Building My First Google Chrome Extension for Salesforce
Building a Chrome Extension was never something I had considered. I’ve used plenty to enhance different applications that I use, but I never had stopped to think about repetitive tasks that I frequently do and ways to try to automate them.
A couple months ago I came across Jesse Altman’s blog post titled Useful Google Chrome Extensions for Salesforce. Up until that time I hadn’t even realized that there might be a library of useful extensions that I hadn’t even looked for, and after reading through his post and searching around through the available extensions on the Chrome Web Store, I decided that I wanted to try to make one myself.
I started out by coming up with a pain point in my day to day work on Salesforce projects: having to work in multiple organizations in the same day, and needing to look up data. Typically the only way to do this is by opening a developer console for each of the different organizations, or keeping Eclipse or MavensMate projects open for each and using their querying tools. I decided that if I created an extension that piggybacked onto the session ID that the browser leverages while signed into a Salesforce organization, I could hook into the REST API and make queries without having to go through any additional authentication.
A quick Google search for people doing something similar brought me to Wes Nolte’s post on Developing Chrome Extensions for Salesforce. Fortunately for me, it had a lot of the pieces that I was going to need, in particular the ability to retrieve the session ID and leveraging ForceTK, which is a Javascript Toolkit that abstracts the REST API.
The problem I wanted to solve required some user interaction, so I then went to Google’s beginner documentation on building Chrome extensions. This sample added a browser action (one of those buttons on the toolbar like AdBlock) that opened an HTML page that showed images. I started to take the pieces from this example and fuse them together with the snippets from what Wes had created to started putting together a way for the user to enter a query into a text area and submit it to Salesforce.
In order to make the browser action talk to Salesforce, I had to implement the HTML and JavaScript on the browser bar, and the additional JavaScript that would be injected into my page. In order to have these two pieces interact, I ended up using message passing. This is how I was able to send a query from an HTML file that was not hosted on Salesforce (and thus didn’t have the session ID).
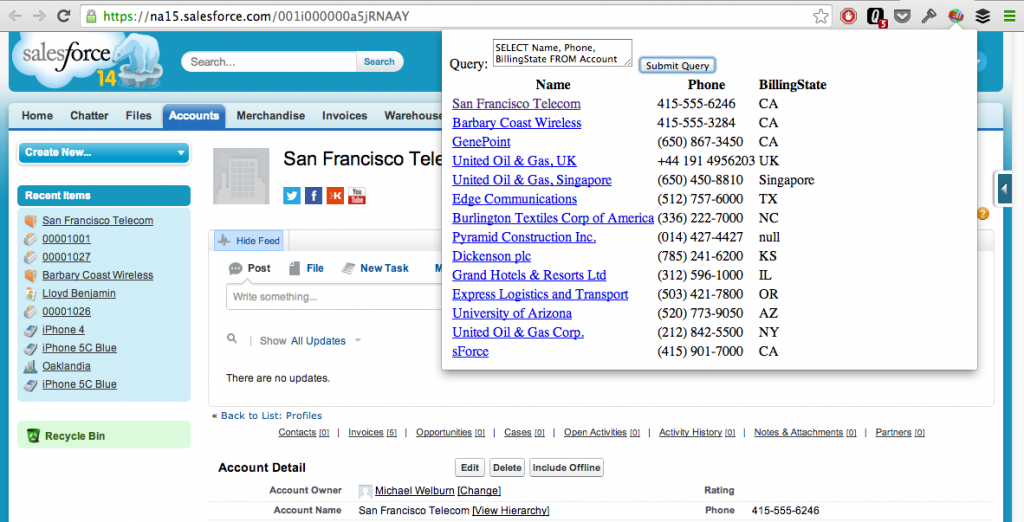
After the pieces were in place, I ended up with the following.
A few notes for beginners:
- When you save an update of your contentscript file(s), you need to refresh the plugin in your browsers extension directory: chrome://extensions/
- To debug the browser action, you need to right click on it and choose Inspect Popup. This will open a separate Developer Tools window for it.
I did run into a couple of minor issues along the way:
- I started getting warnings in my developer tools console about a jQuery map file missing. I ended up having to download the file it was looking for and include it alongside the jQuery file in my resources.
- I also got some cryptic error when attempting to run the query SELECT Id, Name FROM Case that I posted to the Salesforce StackExchange site. While I thought it had something to do with a CORS issue, it turns out I was querying for the non-existent Name attribute on the Case object…
Overall, the learning experience of putting together a quick proof of concept on Chrome Extensions was enlightening. Getting something to work is pretty basic, and since it is all JavaScript there isn’t much of a ramp up (and Google’s documentation seems pretty good).
The POC itself obviously has a lot of features lacking (and bugs), but it gave me some good ideas on better ways to bring this functionality to users. I’ve actually realized that adding another tab to the Developer Tools would be a much better place to run queries (similar to how the AngularJS Batarang extension is implemented).
If you want to take a look at the source code, I put it on GitHub.

